
I. Introduction
Greetings, fellow engineers! I’m VuongVu , and I currently work as a backend engineer at Hanoi Dev Center . In this article, I would like to discuss my experience optimizing the performance of our team’s Golang-related GitHub Actions.
II. Background
During our development process, I found that our team’s GitHub Action workflows were quite slow when building Golang binaries and running tests.
This performance bottleneck worsened over time; as the codebase grew in size and complexity, our testing and containerization workflows became increasingly slow. This made merging even small changes frustrating.
III. Findings
Go Test
The below performance measurement will include -count=1 flag, which will turn off Golang test cache.
$ time go test -count=1 ./…

real    0m29.559s
user    0m27.187s
sys     0m8.423s
Parallel option
$ time go test -count=1 -parallel $(nproc --all) ./…

real    0m29.627s
user    0m27.116s
sys     0m8.278s
From the documentation:
The parallel flag Allow parallel execution of test functions that call t.Parallel, and fuzz targets that call t.Parallel when running the seed corpus. The value of this flag is the maximum number of tests to run simultaneously.
…
Note that -parallel only applies within a single test binary.
Since we want to improve the speed of multiple test binary, this parallel flag does not give us much benefit.
go vet option
Since Golang automatically runs some linters on test compilation through the vet tag, we can disable by the command option, moving go vet to be inside our golangci-lint configuration instead!
For references, go vet is a static analysis tool built into the Go toolchain. It examines Go source code and reports suspicious constructs that are most likely indicative of bugs, but that are legal Go syntax. go vet is commonly being used for checking print format functionality, type assertions, unreachable code, etc…
On the other hand, govet rule in golangci-lint acted the same as go vet command and was enabled by default. While it does not act as a wrapper on top of go vet command, it implemented passes of go vet .
.golangci-lint.yml config:
linters:
  enable:
    - govet
  enable-all: false
  presets:
    - bugs
    - unused
$ time go test -count=1 -vet=off ./...

real    0m20.307s
user    0m21.911s
sys     0m6.415s
We observed a significant performance improvement when disabling the -vet flag during test compilation, reducing the time from 29 seconds to 20 seconds.” or “This change resulted in a notable reduction in test compilation time, from 29 seconds to 20 seconds.
Go Build
GOMAXPROCS configuration
GOMAXPROCSis an environment variable and function in Go that controls the maximum number of operating system threads that can concurrently execute user-level Go code. It essentially limits the parallelism of a Go program by specifying how many OS threads can be used to run goroutines simultaneously.
First, we want to test out whether modifying our GOMAXPROCSsetting would improve our build performance:
$ time go build -o ./build/backend ./backend

real    0m4.825s
user    0m2.68s
sys     0m1.43s
$ time GOMAXPROCS=$(nproc --all) go build -o ./build/backend ./backend

real    0m3.521s
user    0m3.44s
sys     0m6.44s
GOMAXPROCS only tells the Go runtime how many operating‑system threads it may run goroutines on, so it has no influence on the compiler’s own parallelism during go build. If you do notice tiny timing differences when toggling GOMAXPROCS, they are almost always down to normal variance in CPU frequency scaling, cache state, or background activity on the machine, not the flag itself.
However, don’t change GOMAXPROCS to a value higher than the available cores to force more parallelism, since it will spawn more Go threads than cores. It will lead to more expensive context switching and may slow down CPU-intensive tasks.
Changing linker setting
Leveraging prior experience with linker configurations in Rust, I decided to experiment with mold as an external linker for our Golang builds. This will require us to enable CGO_ENABLED=1
A linker is a tool in the software build process that takes compiled object files and combines them into a single executable or library, resolving references between them. Traditional Unix linkers like ld or gold perform this step, but can be relatively slow, especially for large codebases. mold is a modern, high-performance linker designed as a drop-in replacement for existing Unix linkers, offering much faster linking speeds. It supports the same command-line options as ld and is compatible with GCC and Clang, making it easy to adopt without changing build scripts. Mold is fast because it is highly parallelized and fully utilizes all the cores available to it.
The CGO_ENABLED flag in Go controls whether the Go compiler uses cgo, a feature that enables Go code to call C code and link against C libraries. However, using cgo in your project can lead to some trade-offs:
-
- Slow build time: with
cgoenabled, you would have to deal with conversion between Go and C, linking, compiling – which will decrease your build time significantly.
- Slow build time: with
-
- Removal of cross compilation: a great feature of Go is the ability to cross compile your code to different platform. With the usage of cgo, you are now being limited to the C library that you are being coupled with, whether it would work as expected on other platforms.
- Lower performance:
cgoonly acted as a highway between Go and C and it does not guarantee the performance of C. A call to C code would have to pass through all the Go stack, switch to C stack and maybe Operating System calls.
$ CGO_ENABLED=1 go build -ldflags "-linkmode external -extld clang -extldflags -fuse-ld=mold -w" -o ./build/backend ./backend

real    0m5.251s
user    0m4.325s
sys     0m5.145s
As we can see from the above result, using a different linker actually slows down the build time.
I want to go to the bottom of this so I did some tinkering with the perf tool and Go profiling.
As for linker profiling, I did not see any notable difference between the default linker and mold linker during compile time:
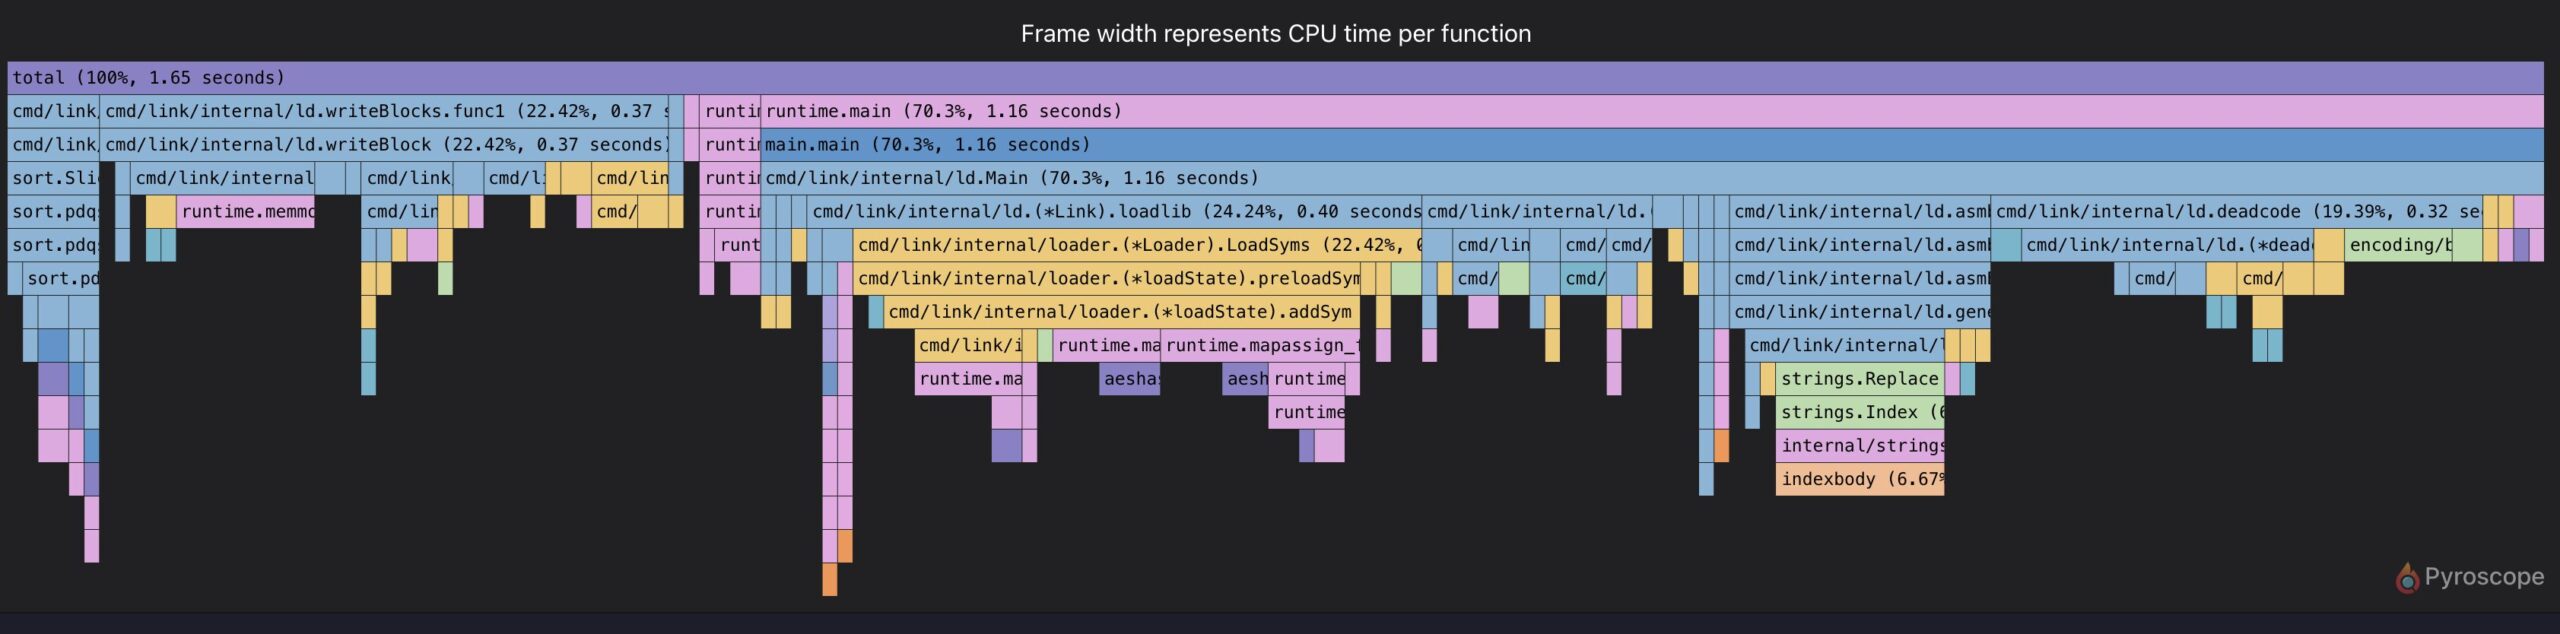
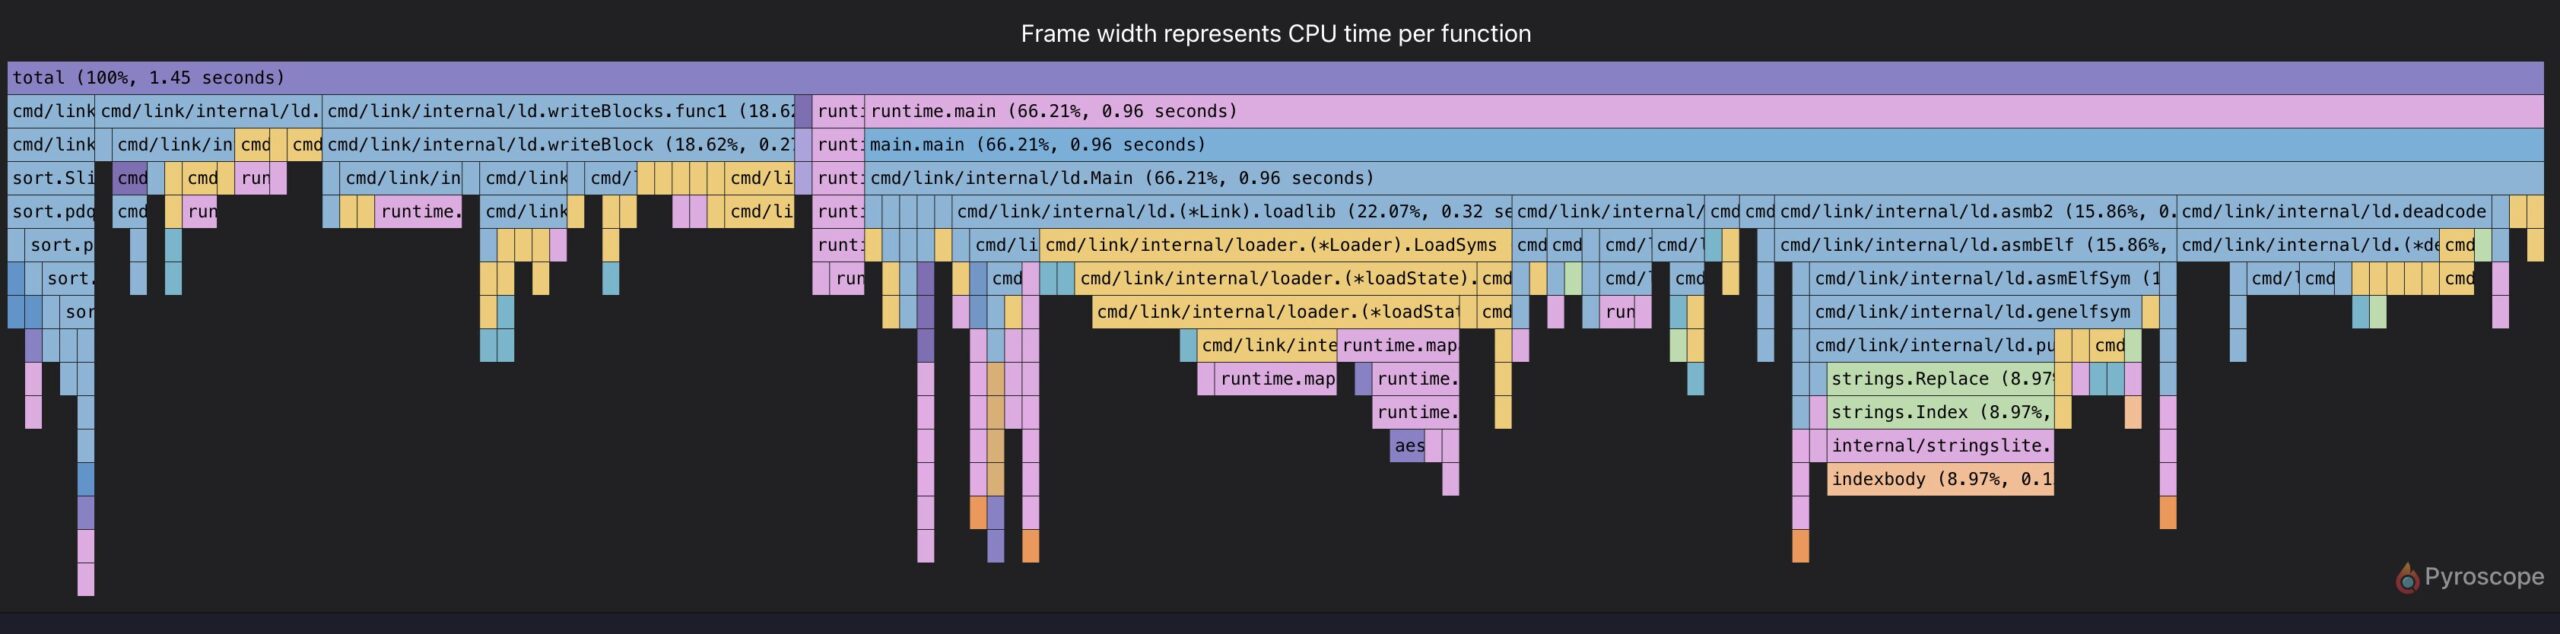
However, when I run the perf tool against our build process (with clearing cache using go clean -cache ), we can have a grasp of what could be the main caused behind this:
- Default linker:
# started on Fri Jul 25 07:48:19 2025
 Performance counter stats for 'go build -trimpath -ldflags -cpuprofile /tmp/default-linker.prof -w -o ./build/server-darwin-arm64 ./entrypoint/server':

         601665.95 msec task-clock                       # 10.075 CPUs utilized
           2922612      context-switches                 # 4.858 K/sec
            105366      cpu-migrations                   # 175.124 /sec
           6207267      page-faults                      # 10.317 K/sec
         cycles
         instructions
         branches
         branch-misses

      59.720204957 seconds time elapsed
     561.778162000 seconds user
40.965784000 seconds sysmoldlinker:
# started on Fri Jul 25 07:49:46 2025
 Performance counter stats for 'go build -trimpath -ldflags -cpuprofile /tmp/mold-linker.prof -linkmode external -extld clang -extldflags -fuse-ld=mold -w -o ./build/server-darwin-arm64 ./entrypoint/server':

         601411.42 msec task-clock                       #  9.470 CPUs utilized
           3294414      context-switches                 #  5.148 K/sec
             90763      cpu-migrations                   #  150.917 /sec
           6711099      page-faults                      #  11.159 K/sec
         cycles
         instructions
         branches
         branch-misses

      63.505848171 seconds time elapsed
     565.632125000 seconds user
      43.049625000 seconds sys
As we can see from the build monitoring, there is an increase in the number of context switches between Go default linker and moldlinker. Also, using mold as linker results in more page faults, resulting in the build process would have to look for data not available on the system memory, reducing the performance overall.
Utilize Github Cache
Another fascinating finding of mine during tinkering is that action/setup-go only caches our Go dependencies but not our Go build.
With some minor adjustments, I added another cache layer for our Go build as below:
- name: Go cache
        uses: actions/cache@v4
        id: cache
        with:
          path: $GO_BUILD_PATH
          key: ${{ runner.os }}-go-build-cache-${{ hashFiles('**/go.sum') }}
I cache only Go’s internal build cache, whose entries are keyed to the exact contents of every source file. Whenever a .go file changes, Go smart cache detects the new hash and recompiles the affected packages, so stale objects never slip through. Furthermore, since I uses multi‑stage in Dockerfile (copy go.mod / go.sum for downloading dependencies first and copy the codebase later), the COPY command changes the build context hash every time a .go file changes, so the subsequent RUN go build … layer is invalidated and re‑executed.
This go build can be used with our Docker container as well by using Docker mount:
- name: Restore Docker cache mounts
        uses: reproducible-containers/buildkit-cache-dance@v2
        with:
          cache-source: go-build-cache
IV. Results
Before
Go Test

Our original unit testing process clocked in at 4 minutes and 15 seconds , partly due to unnecessary static analysis checks during runtime.
Go Build

Previously, our image build flow ran entirely sequentially , without any parallelism or cache optimization. As a result, build times hovered around 3 minutes and 49 seconds , limiting deployment speed and developer feedback cycles.
After
Go Test

By simply disabling the vet check using the -vet=off flag—without compromising test reliability—we brought down the total testing time from 4 m 15 s to just 2 m 15 s . This adjustment alone resulted in a 47% reduction , significantly speeding up CI feedback loops.
Go Build

We fully integrated both GitHub’s dependency cache and Go’s built‑in smart caching mechanisms. As a result, the image build time dropped from 3 m 49 s to only 1 m 34 s —a dramatic 60 % improvement in efficiency, enabling faster iterations and reduced CI costs.
Conclusion
Speeding up your Golang CI workflows might seem like a small win, but it can make a big difference over time. A faster test and build process means less waiting, quicker feedback, and more time spent writing great code. The tips in this post are easy to try and can have a real impact on your day-to-day workflow. Give them a shot—you might be surprised how much smoother your CI feels when everything just moves faster.